How to view detailed information about a website?
Entire website information can view in a single click. To view,
To View a Website
Go to the left sidebar and select Live Monitor >Website Monitor > Click on the action control of the particular Website > Click on the info icon > Choose the relevant tab to view more information.

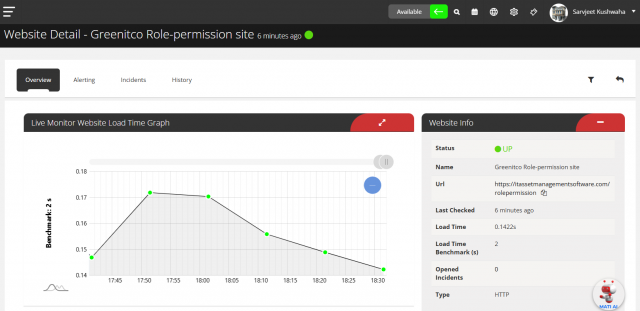
Overview Tab
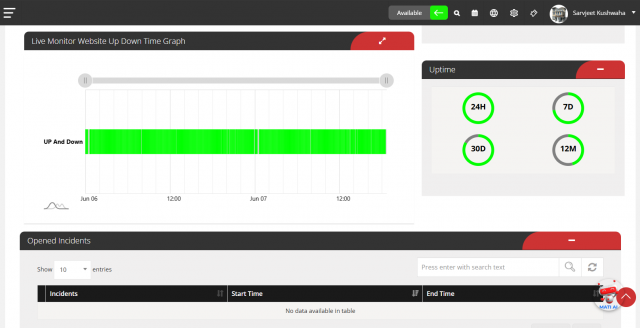
The Overview tab provides a quick summary of system performance and user activity. It displays key metrics such as uptime, response times, recent changes, and alerts. This helps in monitoring overall health and identifying any unusual activity at a glance.
Alert Tab
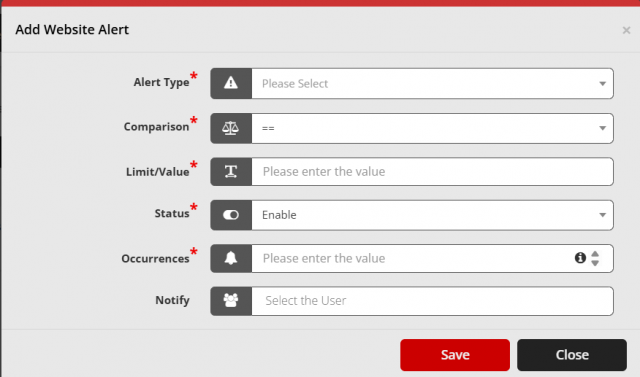
The Alert tab allows you to manage users who will receive email notifications for specific system events or issues. You can add or remove users to ensure the right people are alerted when an incident occurs.

To Add alert user a Website
Go to the left sidebar and select Live Monitor >Website Monitor > Click on the action control of the particular Website > Click on the info icon > Choose the alert tab > Click on the plus icon > Add > Click on Save.
Incidents Tab
The Incidents tab displays a list of all issues or incidents detected on the website. It helps track downtime, errors, and performance-related problems for better monitoring and resolution.

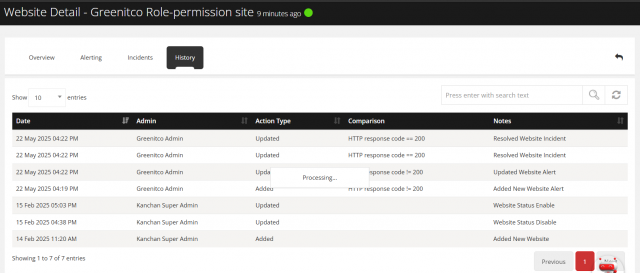
History Tab
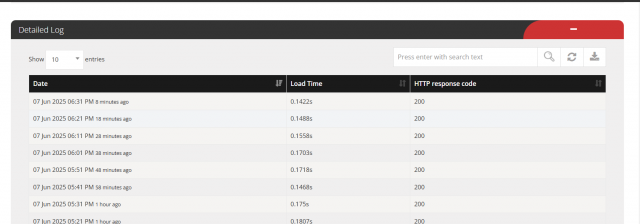
The History tab shows a detailed log of past activities, incidents, and performance data for each website. It helps in analyzing trends, reviewing past issues, and tracking overall uptime and latency over time.
