

Introduction
Management can use the Department Wise Ticket Report to evaluate the ticket volume and issue distribution across departments. It helps identify departments that require additional attention, resources, or process improvements.
Identify High-Issue Departments: Review the total ticket count for each department to identify areas generating a higher volume of service issues.
Analyse Problem Categories: Review category-wise and subcategory-wise ticket counts to understand the most common problems within each department.
Monitor Ticket Status: Analyse the status-wise distribution of tickets to identify departments with a higher number of open, reopened, or pending tickets.
Identify Recurring Issues: Compare ticket patterns across departments to identify frequently reported problems that may require permanent corrective action.
Plan Resources: Use ticket volume and status distribution to assess whether a department requires additional technician support or better workload allocation.
Drive Process Improvements: Use the report insights to prioritise improvement initiatives and reduce recurring service issues.
Management Outcome: The report helps management understand where major issues are concentrated, prioritise departmental improvements, and make informed decisions to improve service efficiency.
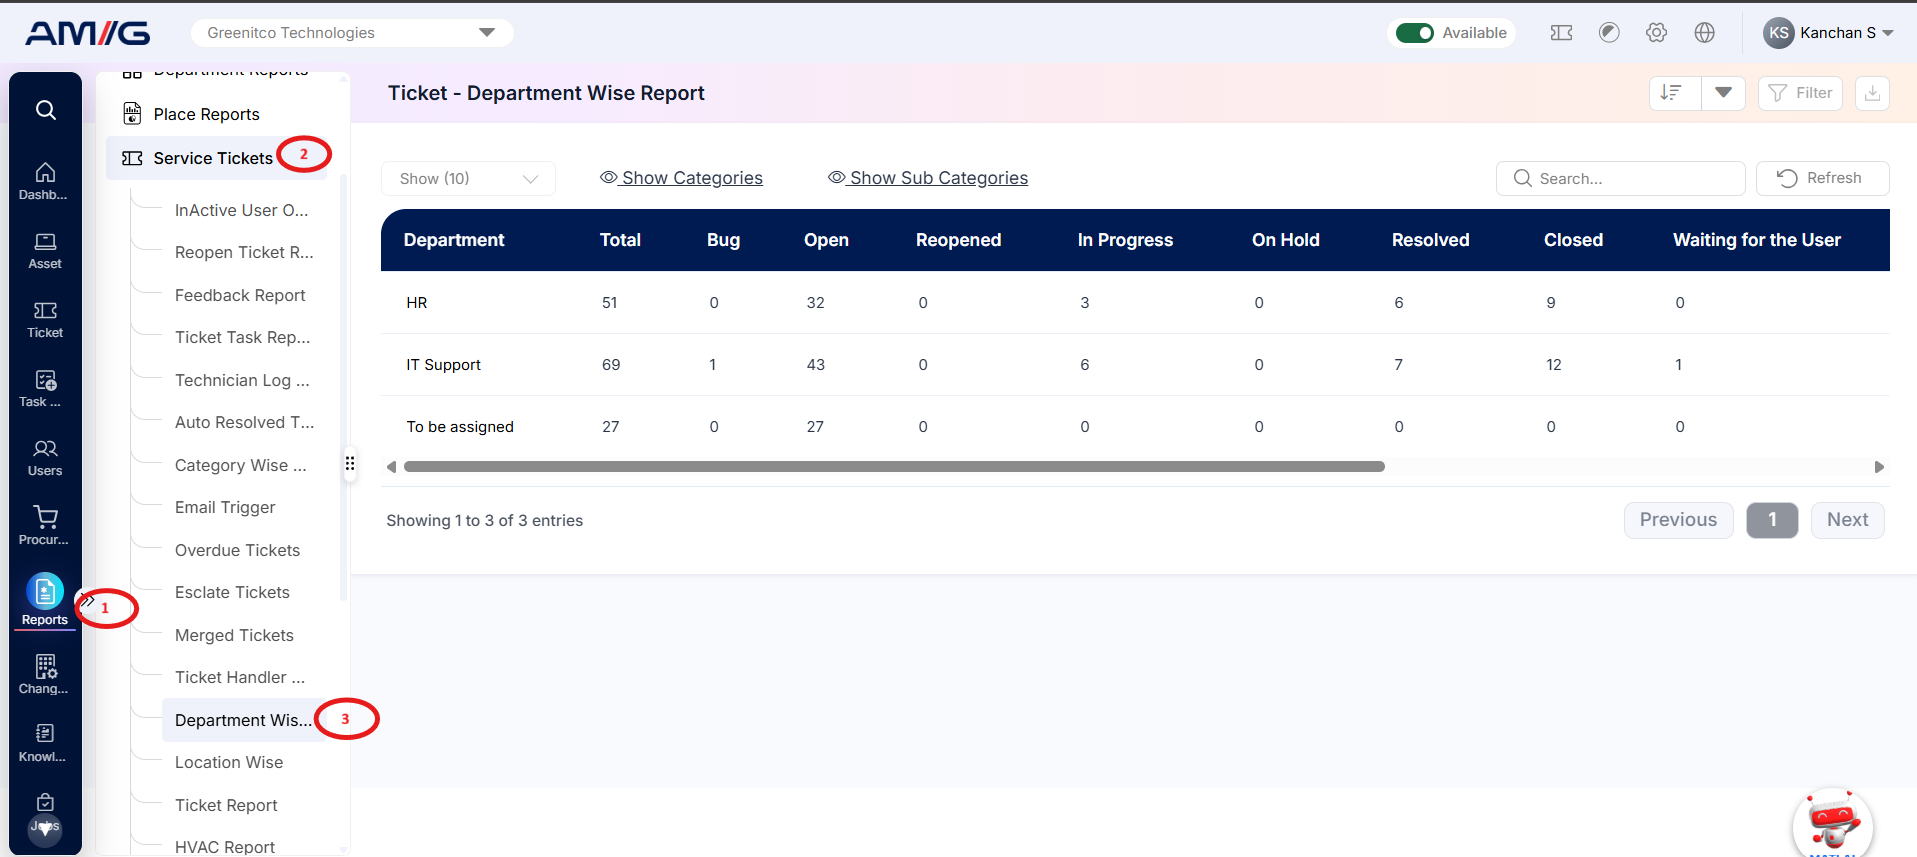
Navigation Path: Sidebar > Reports > Service Ticket > Department Wise Ticket Report
Viewing the Report
Open Department Wise Ticket Report from Sidebar > Reports > Service Ticket > Department Wise Ticket Report. The report opens as a list.
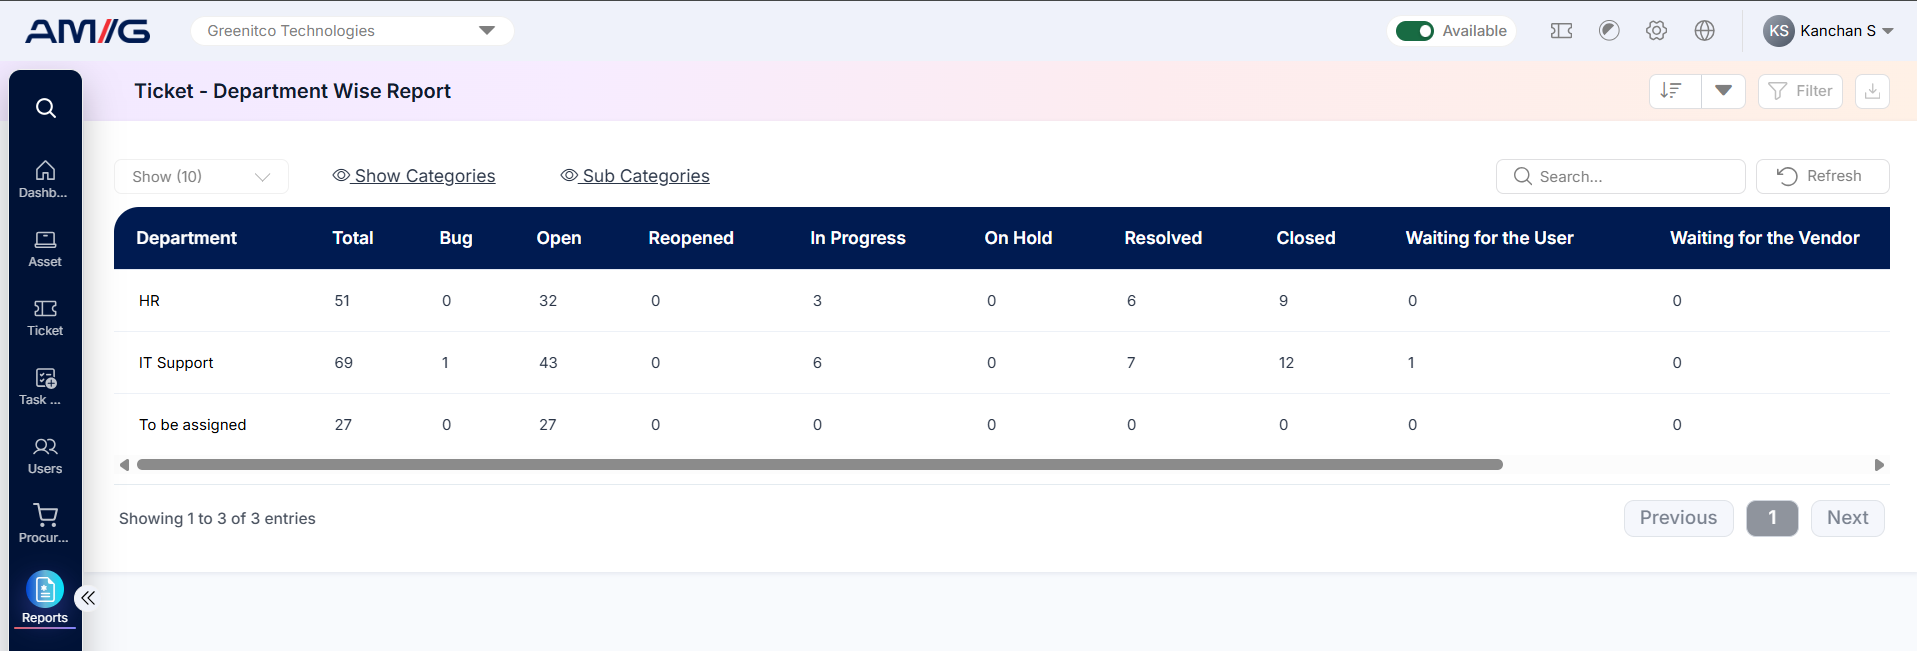
Figure 2.4.1: Department Wise Ticket Report – report listing
Table 2.4.1: Report columns
| Column | What it shows |
|---|---|
| Department | Displays the name of the department associated with the tickets. |
| Problem Category | Displays the problem category under which the tickets are classified. |
| Sub Category | Displays the subcategory associated with the reported issues. |
| Total | Displays the total number of tickets recorded for the department and selected category or subcategory. |
The report also has one column for each ticket status, such as Bug, Issue, QA Test and Open.
Filtering the Report
Step 1: Click Filter at the top-right of the report. The filter panel opens.
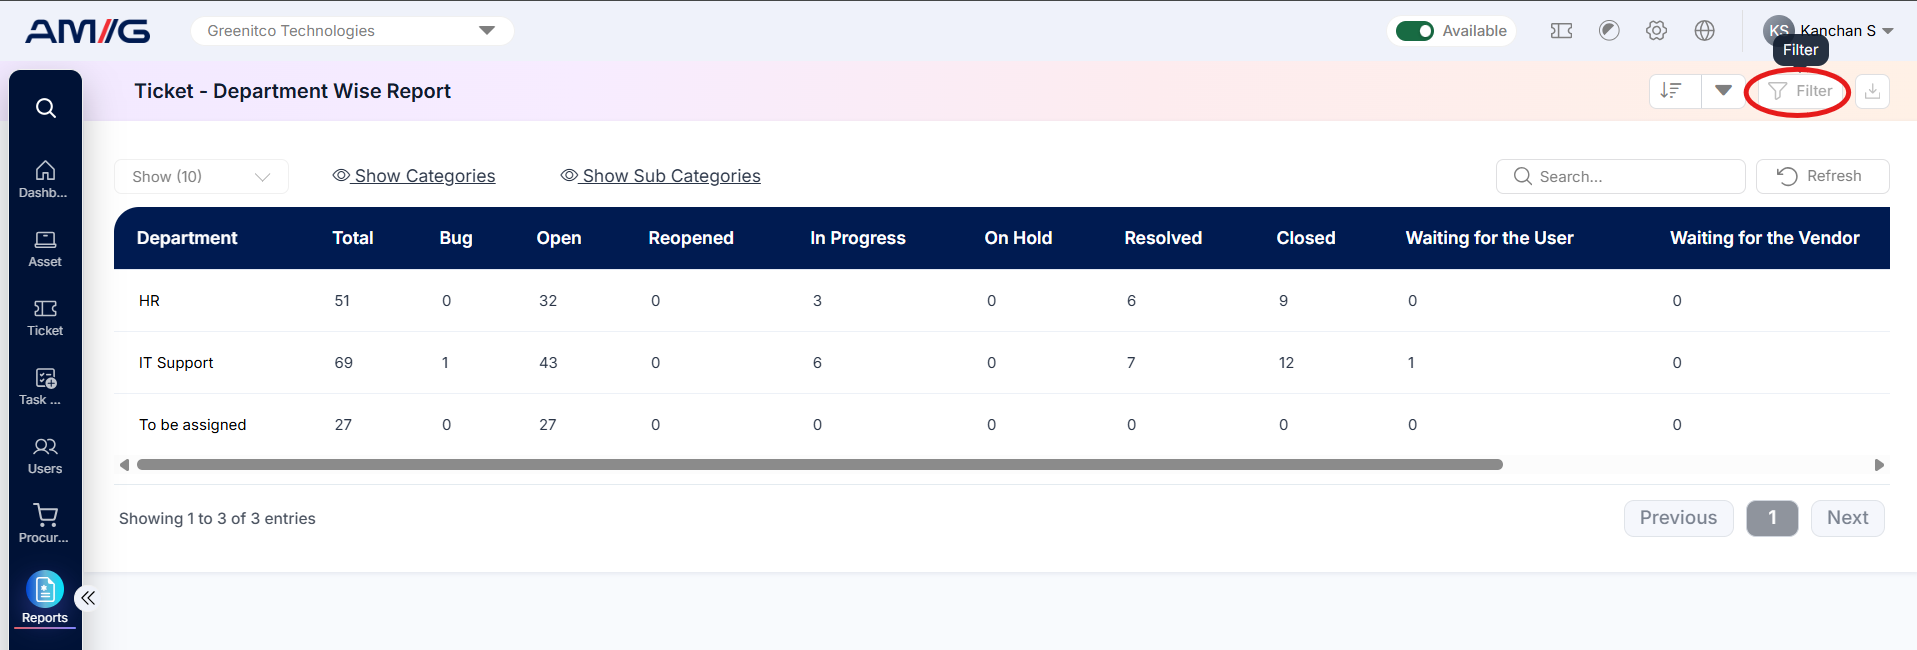 Step 2: Choose the values you need in one or more of the filters listed below.
Step 3: Click Filter (or Apply Filter) to update the report. Click Clear to remove all filters.
Table 2.4.2: Available filters
| Filter | What it does |
|---|---|
| Department | Filters the report to display tickets associated with the selected department. |
| Problem Category | Filters tickets based on the selected problem category. |
| Sub Category | Filters tickets based on the selected problem subcategory. |
| Date | Filters report data based on the selected date criteria. |
| Date Range | Displays tickets recorded within the specified start and end dates. |
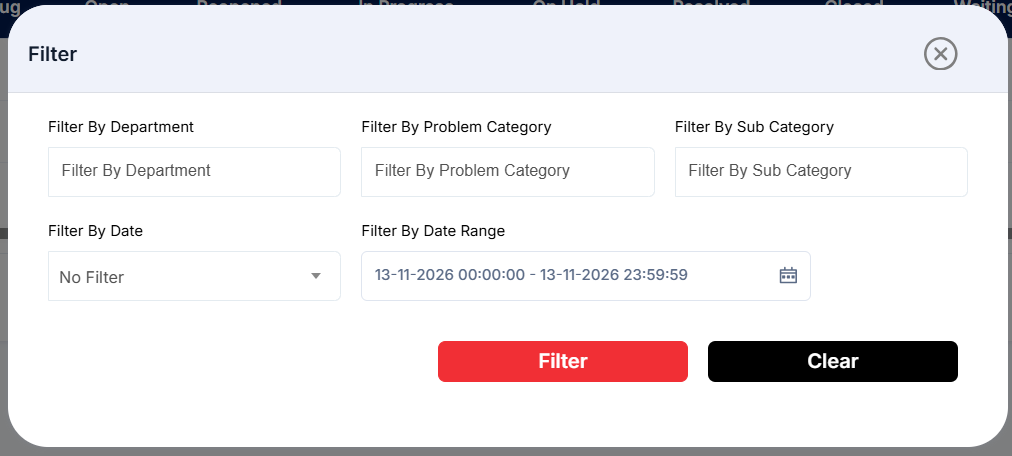
Figure 2.4.2: Department Wise Ticket Report – filter panel
Sorting the Report
Click the Sort button at the top-right corner of the report to view the available sorting options. Select the desired column to sort the report records.
The available sorting options are:
Department
Problem Category
Sub Category
Total
The sorting options also include individual ticket status values, allowing you to sort the report based on the number of tickets in each status.
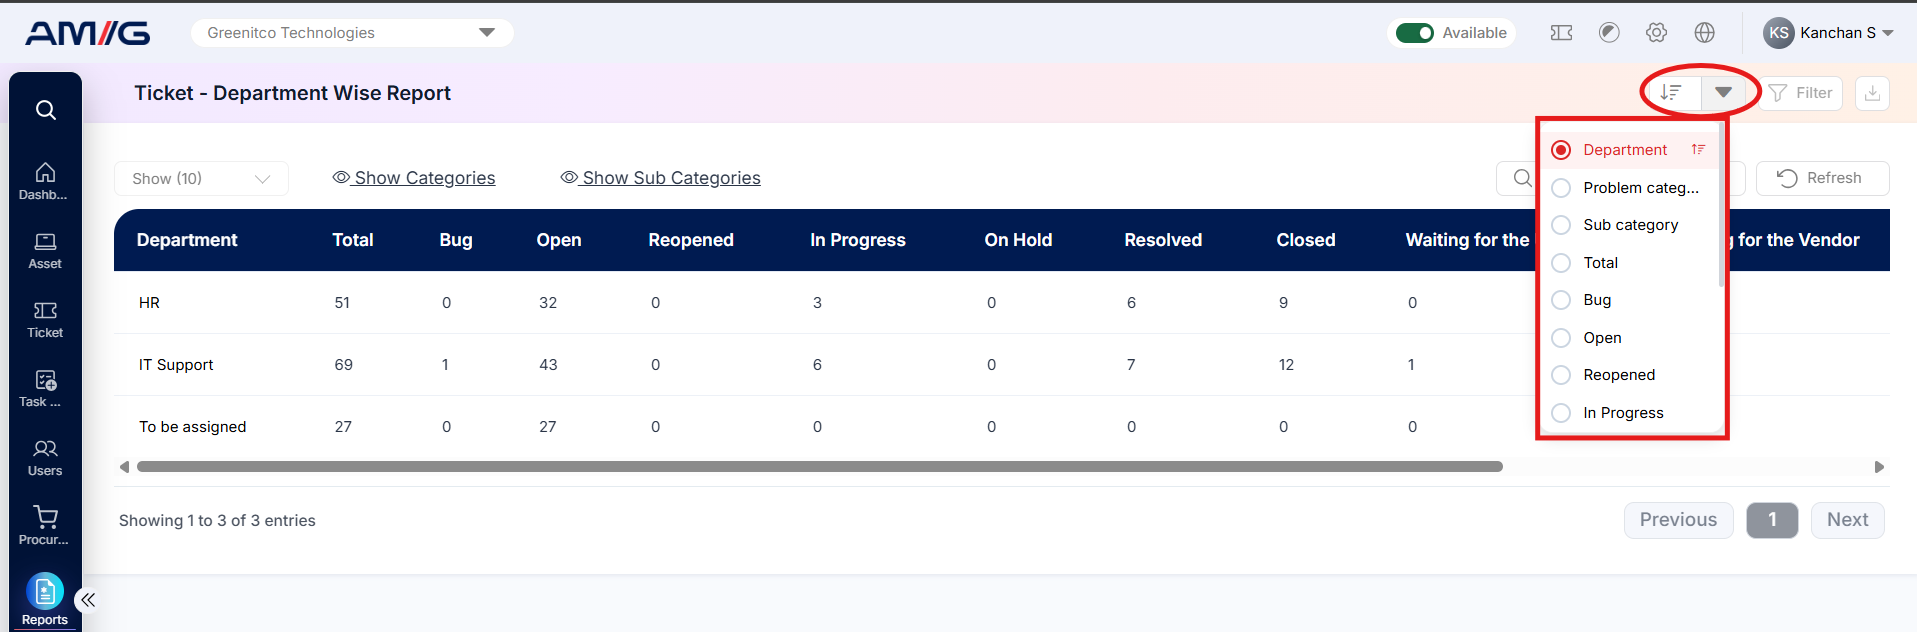
Figure 2.4.3: Department Wise Ticket Report – sort options