

Introduction
The Service Desk is where technicians receive, work on and resolve tickets. A ticket is created when a user reports an issue or asks for something, whether through the portal, by email, by phone call or through a bot. The ticket then moves through statuses until it is resolved, closed and finally archived.
As a technician you will mostly work from your ticket lists and the Ticket Details screen. Supporting tools, such as incidents, problem management, service requests and the Kanban board, help you handle larger issues, approvals and planned work.
Available Modules
The table below summarises the areas covered in this guide. Each area has its own section with step-by-step instructions.
Table 2.1.1: Service Desk areas at a glance
| Area | What you use it for |
|---|---|
| Service Tickets | View your ticket lists, create tickets, and update, comment on, assign, transfer, merge, escalate and resolve tickets. |
| Incidents | Review incident reports and record major incidents, their business impact and root cause. |
| Problem Management | Track underlying problems and the tickets and devices they affect. |
| Change Enablement | Plan and track changes raised from tickets or problems. |
| Service Requests | Raise requests that need approval, follow the approval workflow and act on approvals. |
| Handling and Escalation | Manage your queue, respond to escalations and VIP tickets, request status approvals and stay informed through notifications. |
| Archive | Look up archived tickets and service requests. |
| Service Desk Automation | Understand the automatic actions that create, assign, remind and escalate tickets. |
| Reference | Glossary and quick navigation reference. |
A Typical Ticket Lifecycle
Most tickets follow the path below. Each step links to the section that explains it.
Step 1: A ticket is raised by a user, logged by you from a call, received by email or created by a scheduler.
Step 2: The ticket is assigned automatically, assigned by a lead, or you self-assign it from the queue.
Step 3: You review the ticket, talk to the user through comments and update the status as work progresses.
Step 4: If needed, you transfer, merge, escalate, or link the ticket to an incident, problem or change.
Step 5: You resolve the ticket. The user can leave feedback, and resolved tickets close automatically after the configured period.
Step 6: Closed tickets are archived after the configured number of days.
Your Technician Dashboard
The Dashboard provides a centralized view of service activities and overall organizational performance. It helps users understand the current operational status, identify critical issues, monitor performance, and determine areas requiring attention.
The Service Ticket Dashboard presents a visual summary of ticket activity and service performance, including ticket counts, status distribution, SLA compliance, response and resolution trends, user feedback, and workload. These insights help teams identify bottlenecks, prioritize critical issues, and make informed decisions to improve service delivery.
The information displayed depends on the selected dashboard view, date range, and the user's access permissions.
Navigation Path: Sidebar > Dashboard
Step 1:From the left navigation menu, select Dashboard. The Service Ticket Dashboard opens.
Step 2: Select the Technician view and, where available, choose the company.
Step 3: Set the date and time range for the reporting period.
Step 4: Click the Refresh icon to reload the dashboard with the selected filters.
Table 2.1.2: Technician Dashboard cards
| Card | What it shows |
|---|---|
| Technician Details | Your companies and departments, and your overall SLA achievement percentage. |
| Company-wise Ticket Summary | Total tickets assigned to you per company, including tickets resolved within SLA and tickets that breached SLA. |
| Ticket Resolution Time | How long you take to resolve tickets for each company. |
| Ticket Response Time | Your daily response time for each company. |
| Ticket SLA Alerts | Your tickets that have breached SLA or are close to the breach limit – use this to prioritise urgent work. |
| SLA Achieved vs. Breached | Tickets handled within SLA compared with tickets that breached it. |
| Daily Feedback Trend | Daily feedback received for your work. |
| Ticket Priority Distribution | Your assigned tickets by priority. |
| Ticket by Channel | The channels through which your tickets were created. |
| Top Issues by Company | A tag cloud of frequently reported issues among your tickets. Larger tags mean more tickets. |
| Company Leaderboard | Your ranking compared with other technicians in each company. |
| Service Request Summary | An overview of service requests assigned to you. |
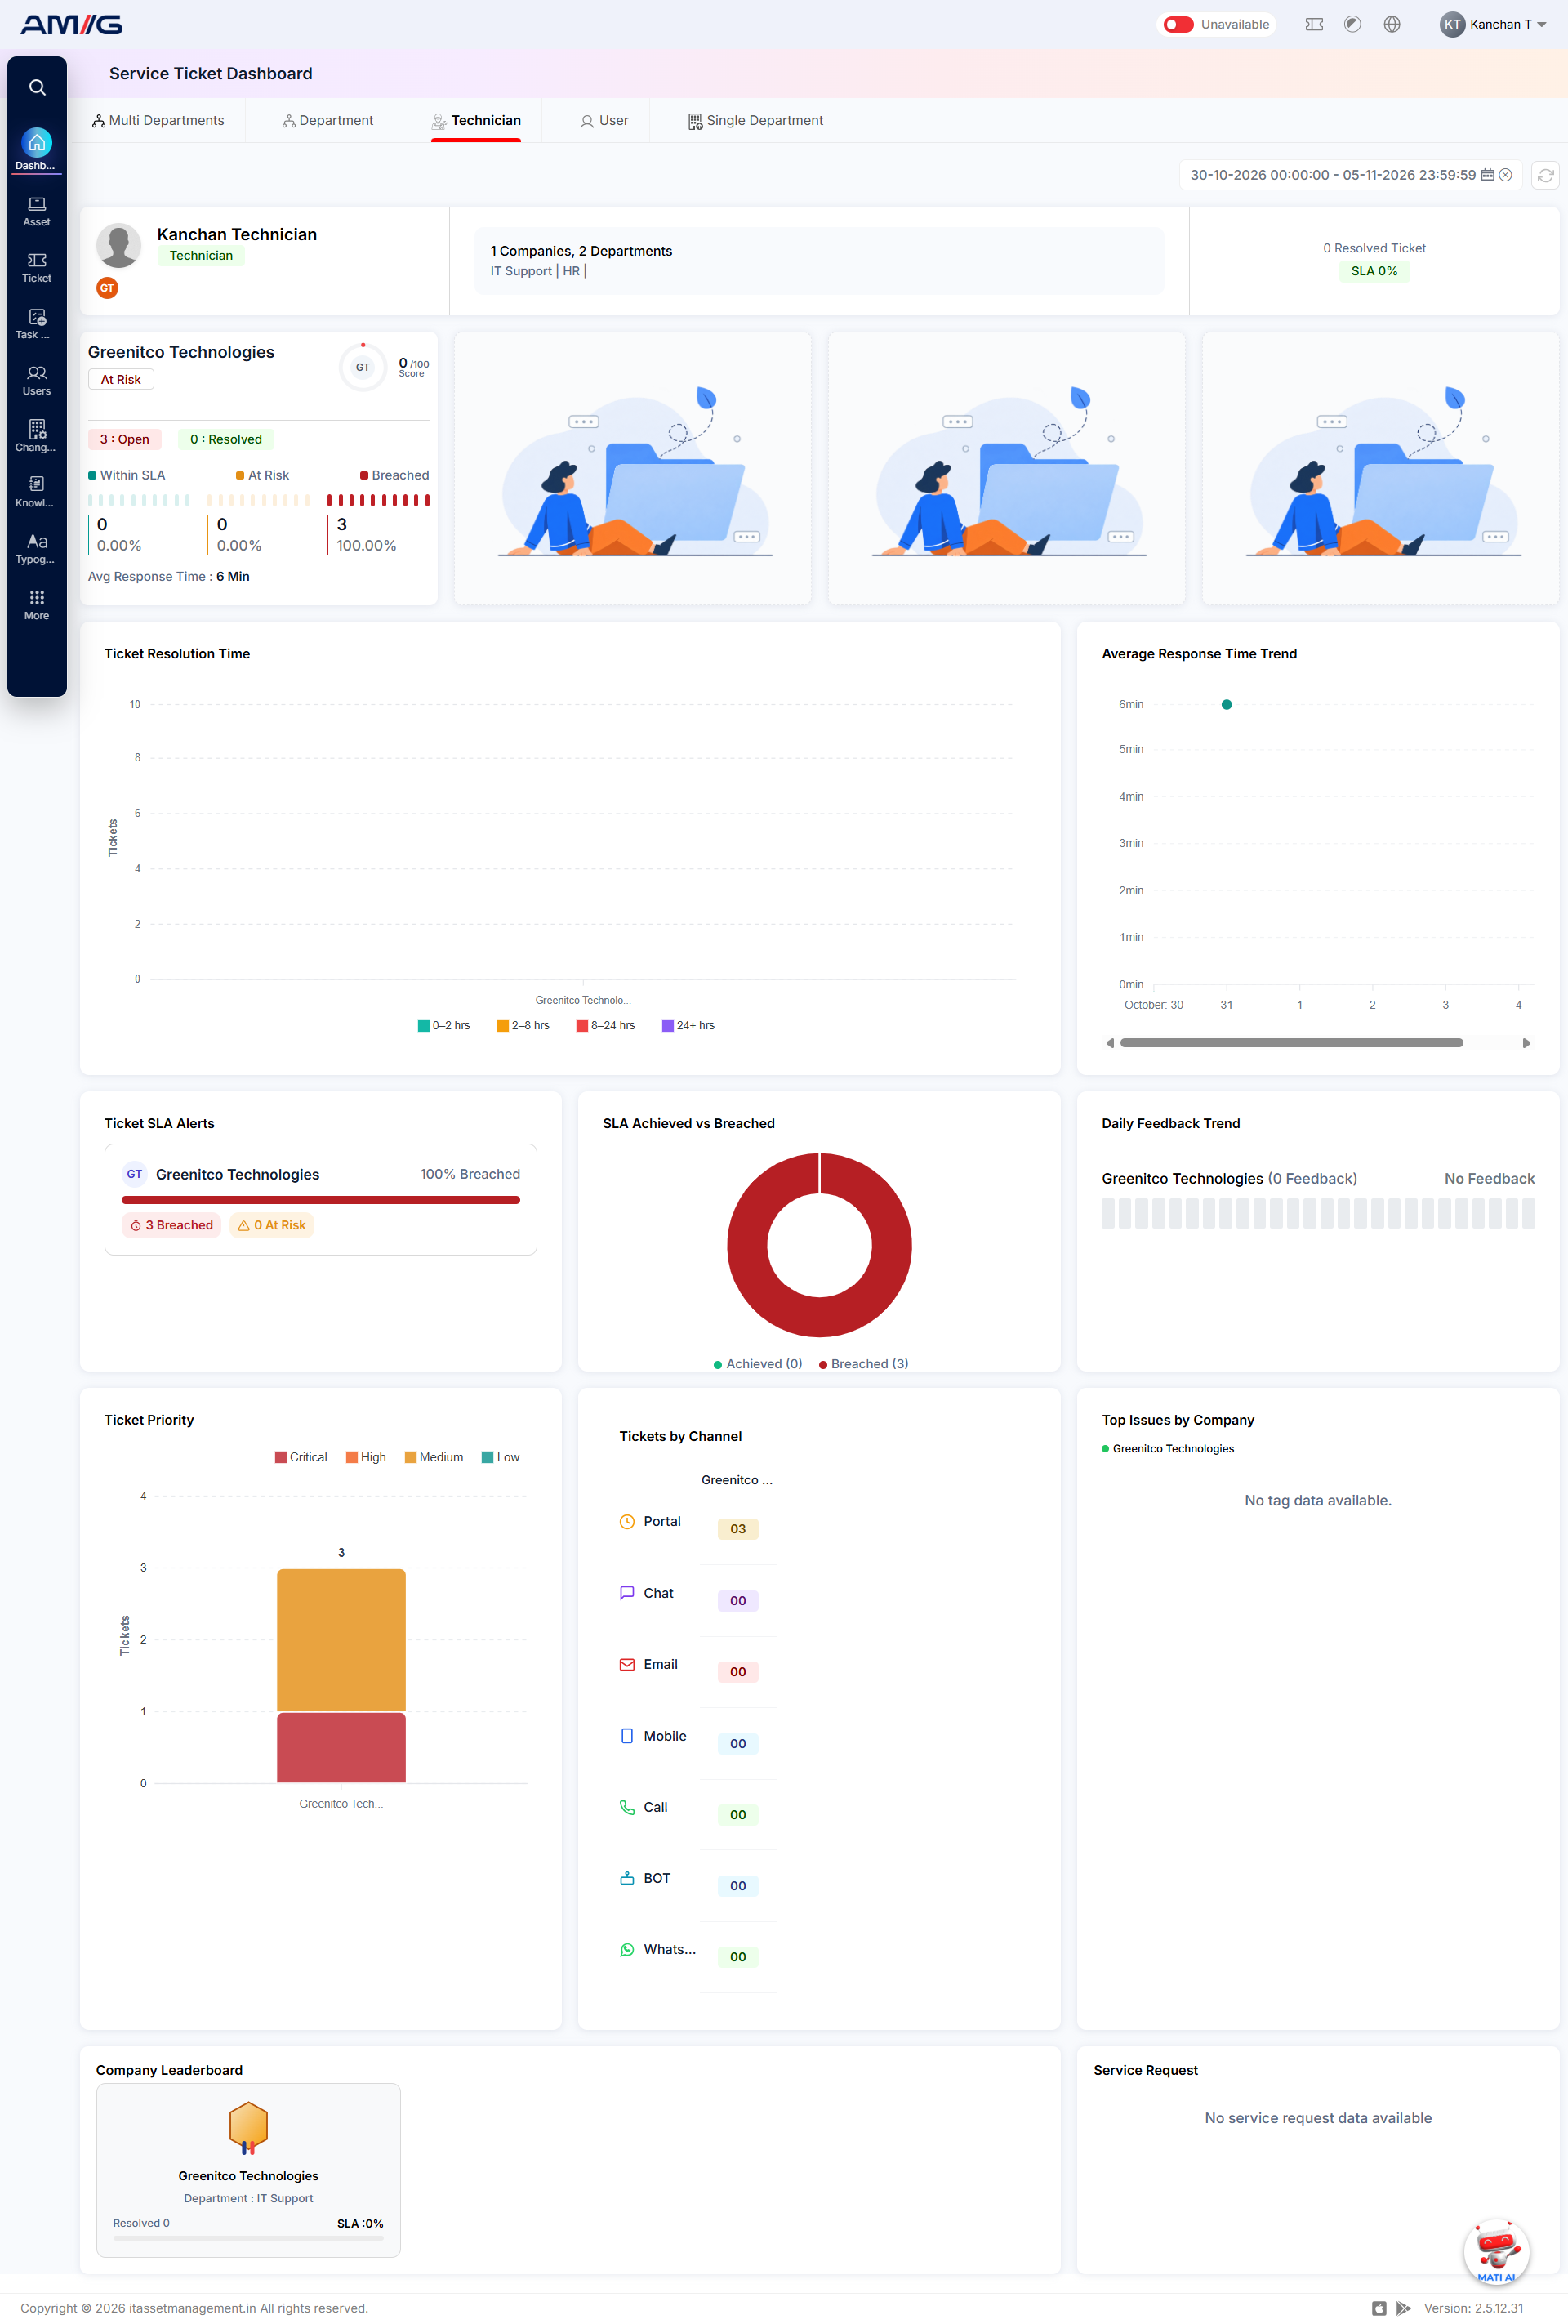
Figure 2.1.1: Service Ticket Dashboard – Technician view
Note: Some cards may show no data when no records match the selected company and date range.