Custom Graph
Go to the left sidebar and select Reports > Click on the Service Report > Custom Graph.**
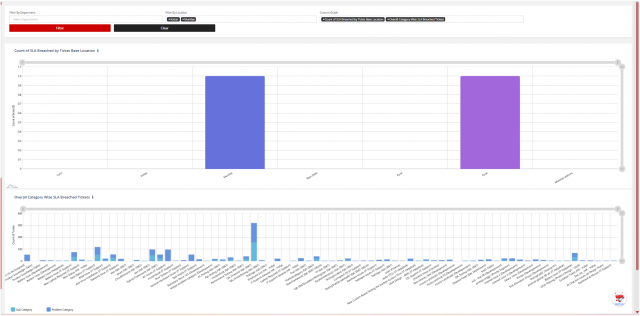
The Custom Graph feature helps management analyse SLA performance, identify problem areas by location or category, compare ticket trends, and make data-driven decisions using customised graphical views.
We are continuously improving our documentation to ensure it meets your needs. This document will be updated regularly, so please check back for the latest information. If you have any questions or encounter any issues, feel free to reach out to us at support@itassetmanagement.in.