

Introduction
The Category Wise Aging Report (displayed on the screen as Ticket - Category wise Aging Report) provides an overview of ticket aging, grouped by department and problem category. It helps users understand how long tickets have remained open and identify pending tickets that require attention.
The report categorizes tickets based on their age, distinguishing between tickets created within the last 7 days and those older than 7 days. It further separates the ticket counts into active and inactive statuses, providing better visibility into ticket aging and workload distribution.
Use this report to:
-
Monitor ticket aging across different departments and categories.
-
Identify tickets that have remained pending for more than 7 days.
-
Compare active and inactive ticket counts based on their age.
-
Identify departments and categories with a high number of aging tickets.
-
Track long-pending issues and prioritize follow-up actions.
-
Evaluate the overall status of ticket resolution and workload management.
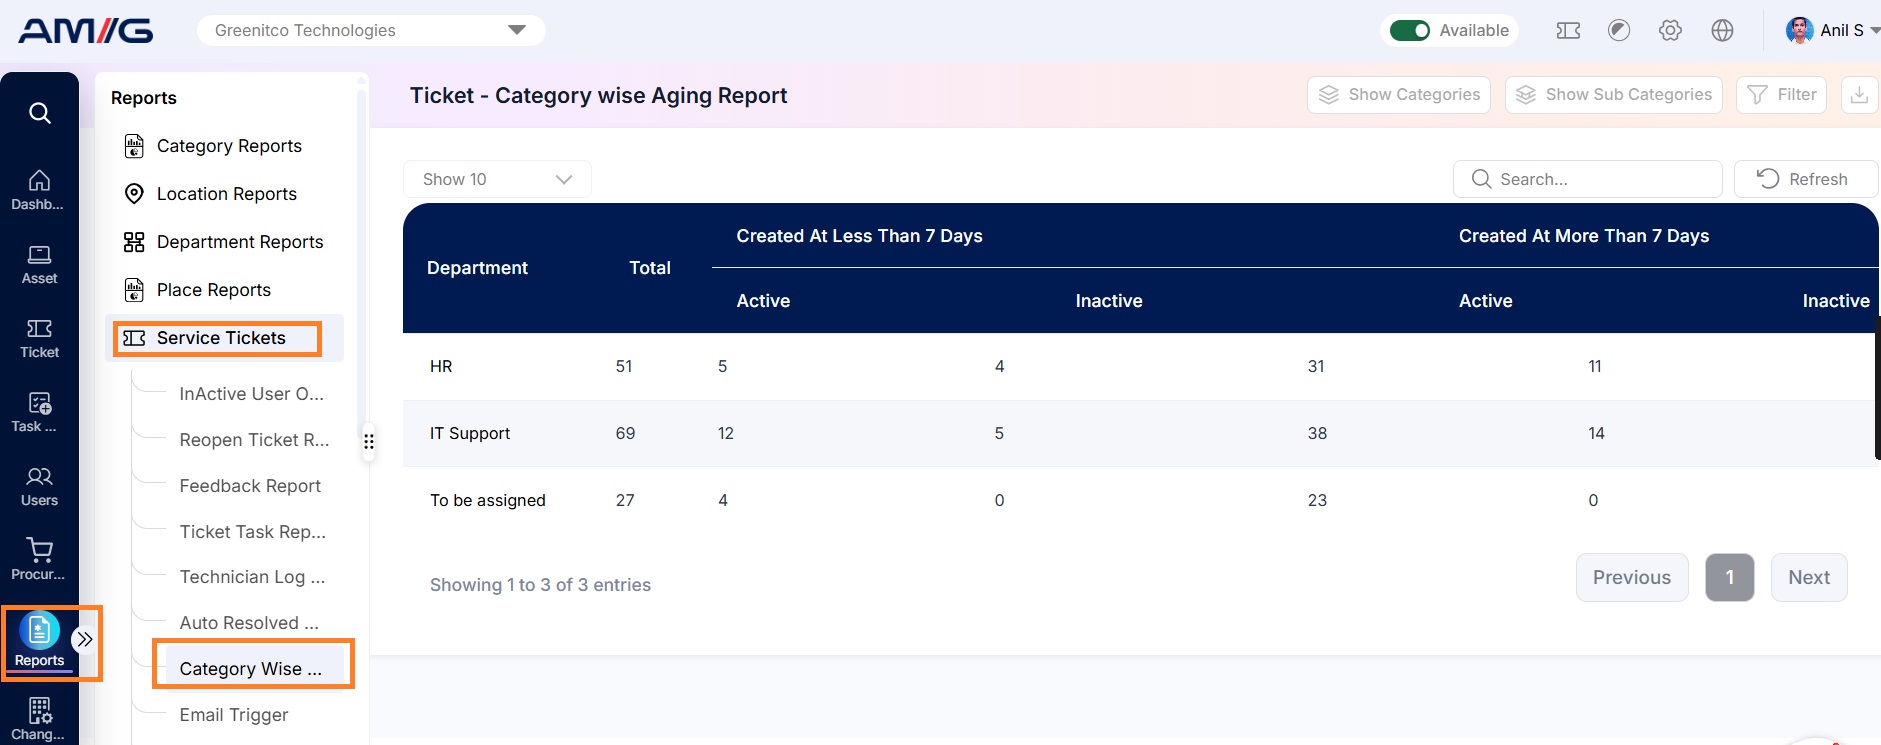
Navigation Path: Sidebar > Reports > Service Ticket > Category Wise Aging Report
Viewing the Report
Open Category Wise Aging Report from Sidebar > Reports > Service Ticket > Category Wise Aging Report. The report opens as a list.
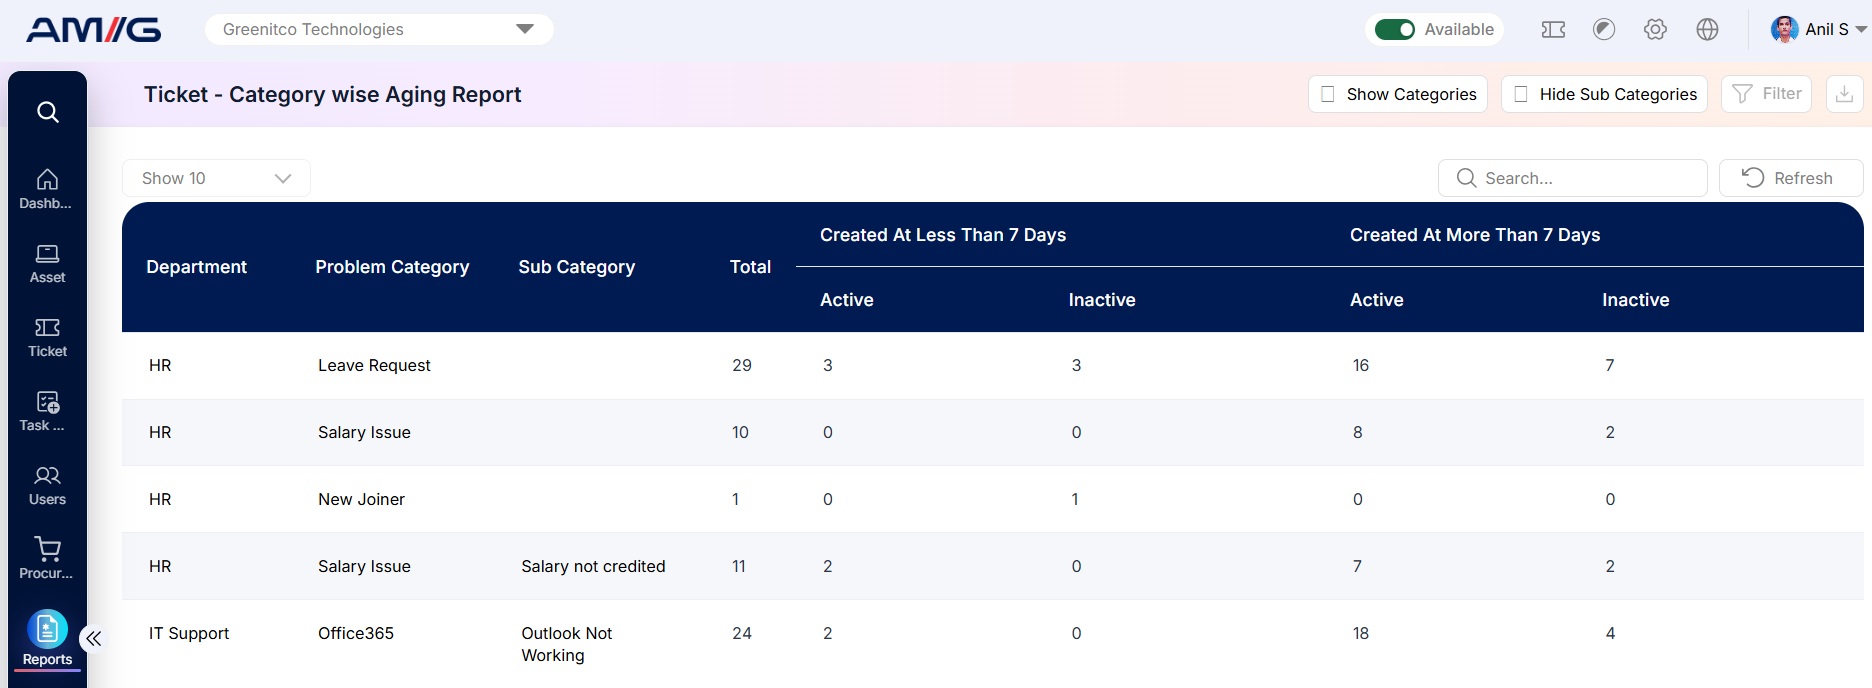 Figure 2.15.1: Category Wise Aging Report – report listing
Table 2.15.1: What each column shows
| Column | What it shows |
|---|---|
| Department | The department the tickets belong to. |
| Total | The total number of tickets for the department. |
| Created At Less Than 7 Days – Active | Tickets created in the last 7 days that are still open. |
| Created At Less Than 7 Days – Inactive | Tickets created in the last 7 days that are already resolved or closed. |
| Created At More Than 7 Days – Active | Tickets older than 7 days that are still open. A high number here means tickets are ageing. |
| Created At More Than 7 Days – Inactive | Tickets older than 7 days that are resolved or closed. |
Table 2.15.2: Buttons and controls on the report
| Control | What it does |
|---|---|
| Show | Choose how many entries appear on each page (10 by default). |
| Search | Find entries by typing any value shown in the report. |
| Refresh | Reloads the report with the latest data. |
| Show Categories | Breaks the counts down by problem category. |
| Show Sub Categories | Breaks the counts down further by sub-category. |
| Filter | Opens the filter panel so you can narrow down the report. |
| Download | The icon at the top-right. Downloads the report as a file. |