

Introduction
The Ticket Pendency Report provides a consolidated overview of pending tickets, helping management analyse how long tickets have remained unresolved across different categories and technicians. It highlights ticket pendency based on category, department, and technician, providing visibility into areas where tickets are accumulating and require attention.
The report is divided into two tabs: Ticket and Technician, offering two different perspectives for analysing pending tickets.
Ticket Tab: Provides a category-wise view of pending tickets, grouped by Company, Department, Problem Category, and Sub Category. It helps management identify which departments or problem categories have a higher volume of pending tickets and understand how long those tickets have remained unresolved.
Technician Tab: Provides a technician-wise view of ticket pendency, helping management review pending workloads across assigned technicians and identify where follow-up or additional support may be required.
The report categorises ticket pendency into different ageing buckets, such as Up to 5 Days, 5 to 10 Days, 10 to 15 Days, 15 to 30 Days, and 1 Month Above. This makes it easier to identify tickets that have remained pending for longer periods and require prioritised attention.
By analysing both category-wise and technician-wise pendency, management can identify recurring backlogs, assess workload distribution, determine which departments or technicians need intervention, and plan appropriate corrective actions. Overall, the report supports better workload management, timely follow-ups, and improved ticket resolution efficiency.
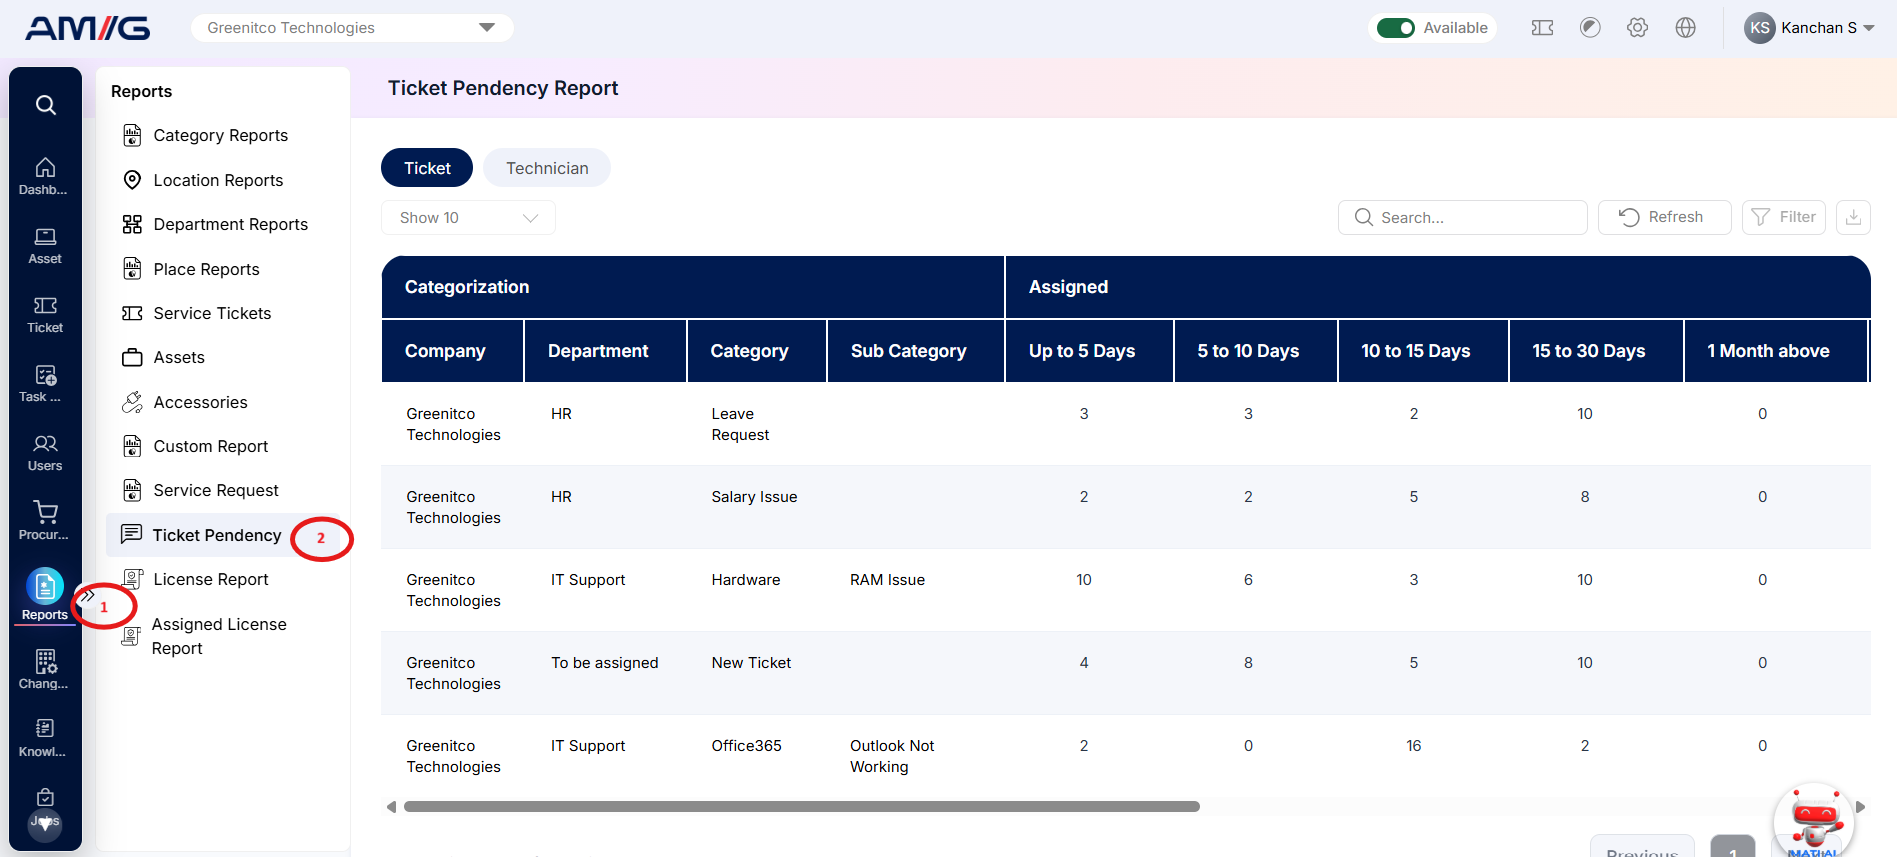
Navigation Path: Sidebar > Reports > Service Ticket > Ticket Pendency Report
Viewing the Report
Open Ticket Pendency Report from Sidebar > Reports > Service Ticket > Ticket Pendency Report. The report opens as a list.
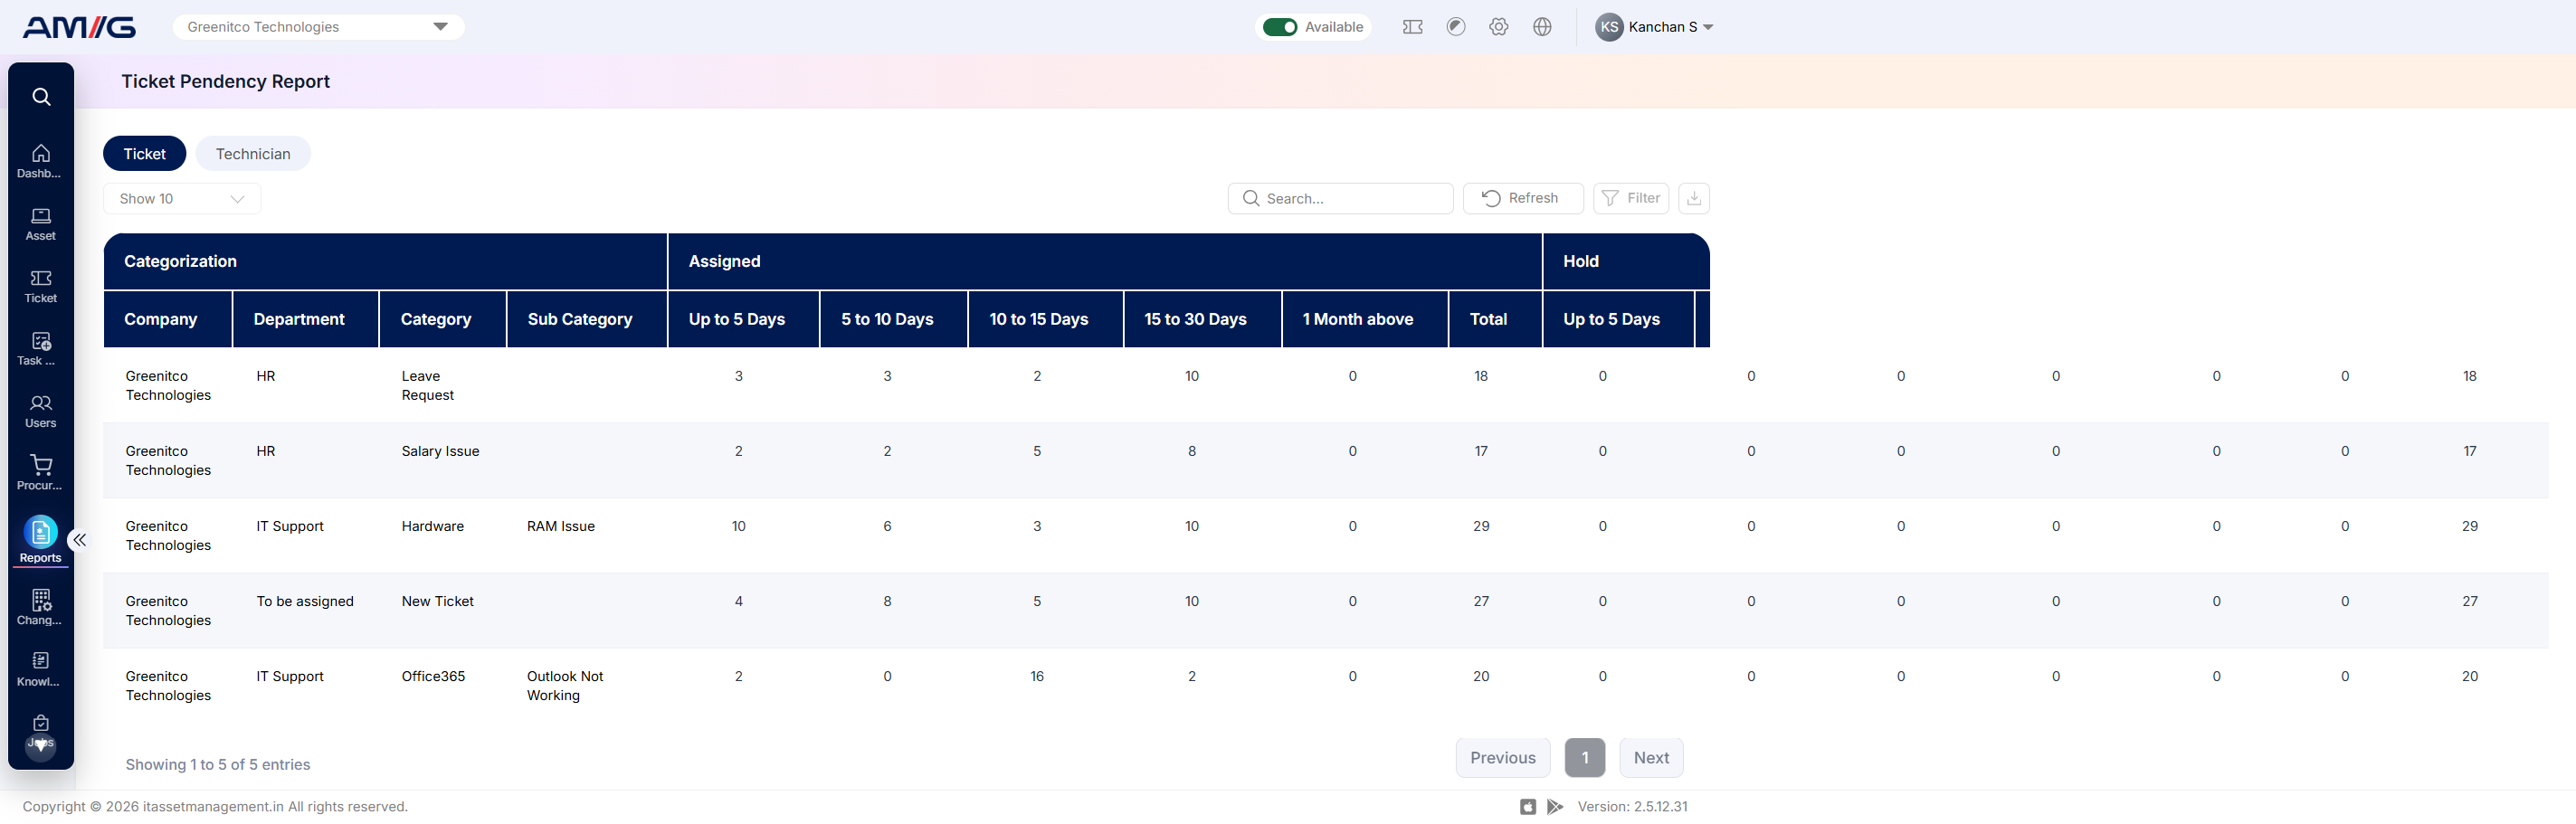
Figure 2.8.1: Ticket Pendency Report – report listing
Table 2.8.1: Report columns
| Column | What it shows |
|---|---|
| Company | Displays the name of the company associated with the pending tickets, helping users identify ticket pendency across different companies. |
| Department | Displays the department associated with the pending tickets, allowing management to identify departments with higher ticket backlogs. |
| Category | Displays the problem category under which pending tickets are classified, helping users identify categories with a higher number of unresolved tickets. |
| Sub Category | Displays the specific problem subcategory associated with pending tickets, providing a more detailed breakdown of ticket pendency. |
| Up to 5 Days | Displays the number of tickets that have remained pending for up to 5 days within the respective company, department, category, and subcategory. |
| 5 to 10 Days | Displays the number of tickets that have remained pending for 5 to 10 days, helping users monitor tickets approaching longer pendency periods. |
| 10 to 15 Days | Displays the number of tickets that have remained pending for 10 to 15 days, highlighting tickets that may require additional follow-up. |
| 15 to 30 Days | Displays the number of tickets that have remained pending for 15 to 30 days, helping management identify prolonged ticket backlogs requiring attention. |
| 1 Month above | Displays the number of tickets that have remained pending for more than one month, highlighting long-pending issues that may require prioritised action or escalation. |
Note: The ageing columns represent the number of pending tickets within each duration range. These values help management compare ticket pendency across companies, departments, problem categories, and subcategories to identify areas requiring corrective action.
Filtering the Report
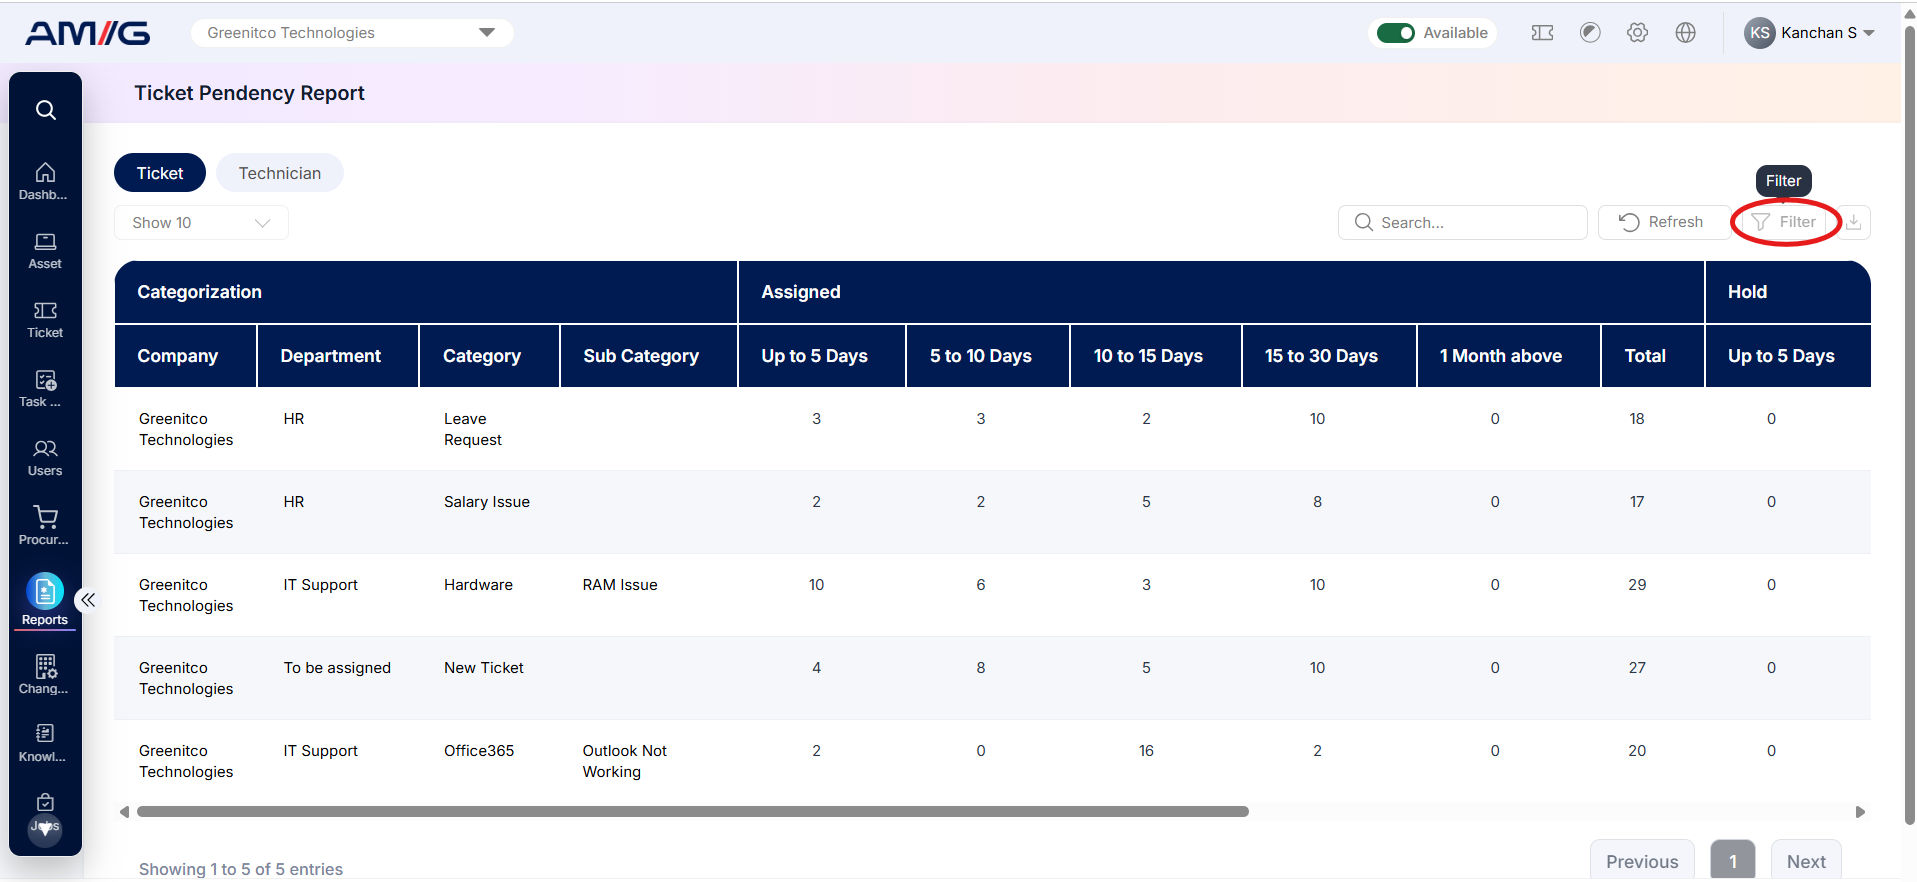
Step 1: Click Filter at the top-right of the report. The filter panel opens.
 Step 2: Choose the values you need in one or more of the filters listed below.
Step 3: Click Filter (or Apply Filter) to update the report. Click Clear to remove all filters.
Table 2.8.2: Available filters
| Filter | What it does |
|---|---|
| Company | Filters the report to display pending ticket details for the selected company. |
| Department | Displays pending tickets associated with the selected department. |
| Problem Category | Filters pending tickets according to the selected problem category. |
| Sub Category | Narrows down the report to pending tickets associated with the selected problem subcategory. |
| Assigned To | Displays pending tickets assigned to the selected technician or ticket handler, helping review individual workloads. |
| Location | Filters pending tickets based on the selected location. |
| Date | Filters report records based on the selected date criteria. |
| Date Range | Displays pending tickets recorded within the specified start and end dates. |
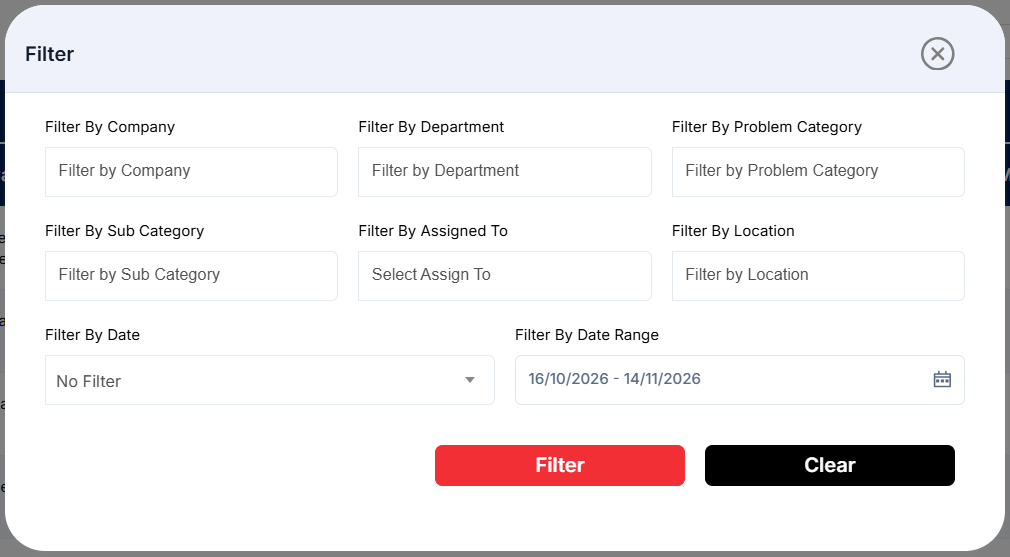
Figure 2.8.2: Ticket Pendency Report – filter panel
Ticket Tab
The Ticket tab displays pending ticket details based on company, department, problem category, and subcategory. It helps users identify ticket backlogs across different categories and monitor how long tickets have remained pending.
Step 1: Open the Ticket Pendency Report page.
Step 2: Click the Ticket button to view ticket pendency details based on categorization.
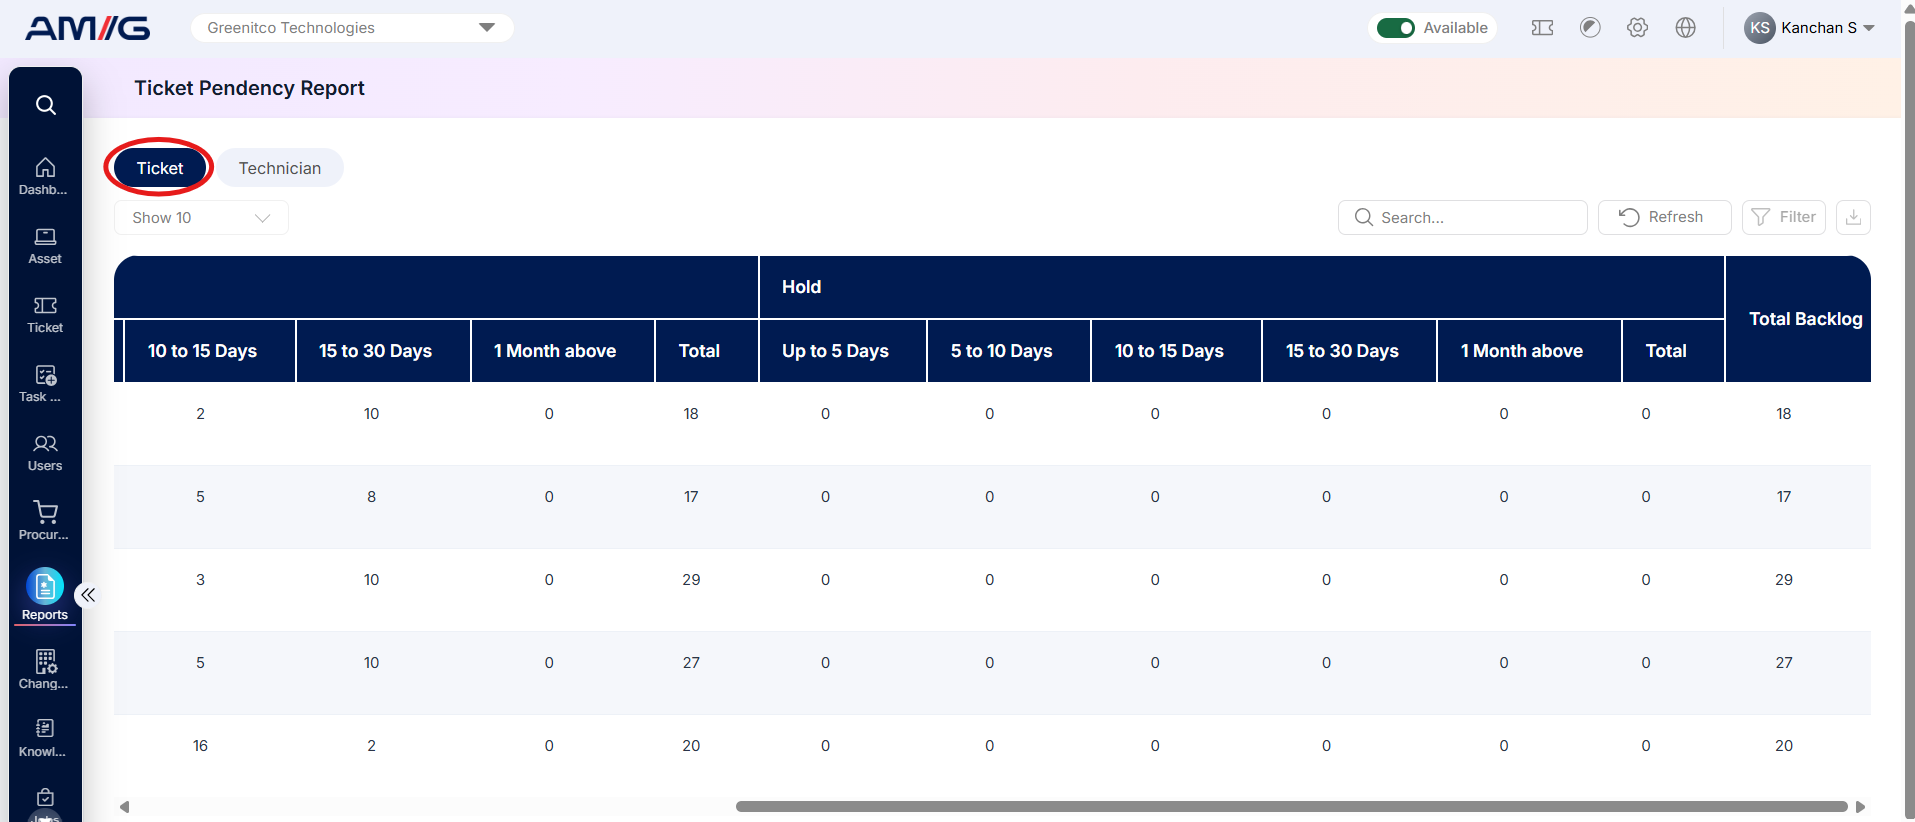 The report displays the following columns:
| Field | Description |
|---|---|
| Company | Displays the name of the company associated with the pending tickets. |
| Department | Displays the department associated with the pending tickets. |
| Category | Displays the problem category under which pending tickets are classified. |
| Sub Category | Displays the specific problem subcategory associated with pending tickets. |
| Up to 5 Days | Displays the number of assigned tickets pending for up to 5 days. |
| 5 to 10 Days | Displays the number of assigned tickets pending for 5 to 10 days. |
| 10 to 15 Days | Displays the number of assigned tickets pending for 10 to 15 days. |
| 15 to 30 Days | Displays the number of assigned tickets pending for 15 to 30 days. |
| 1 Month above | Displays the number of assigned tickets pending for more than one month. |
| Total | Displays the total number of assigned pending tickets. |
| Hold – Up to 5 Days | Displays the number of tickets on hold for up to 5 days. |
| Hold – 5 to 10 Days | Displays the number of tickets on hold for 5 to 10 days. |
| Hold – 10 to 15 Days | Displays the number of tickets on hold for 10 to 15 days. |
| Hold – 15 to 30 Days | Displays the number of tickets on hold for 15 to 30 days. |
| Hold – 1 Month above | Displays the number of tickets on hold for more than one month. |
| Hold – Total | Displays the total number of tickets currently on hold. |
| Total Backlog | Displays the total number of pending tickets, including assigned and on-hold tickets. |
Technician Tab
The Technician tab displays pending ticket details based on the assigned technician. It helps users monitor individual technician workloads and identify tickets that have remained pending for different durations.
Step 1: Open the Ticket Pendency Report page.
Step 2: Click the Technician button to view ticket pendency details technician-wise.
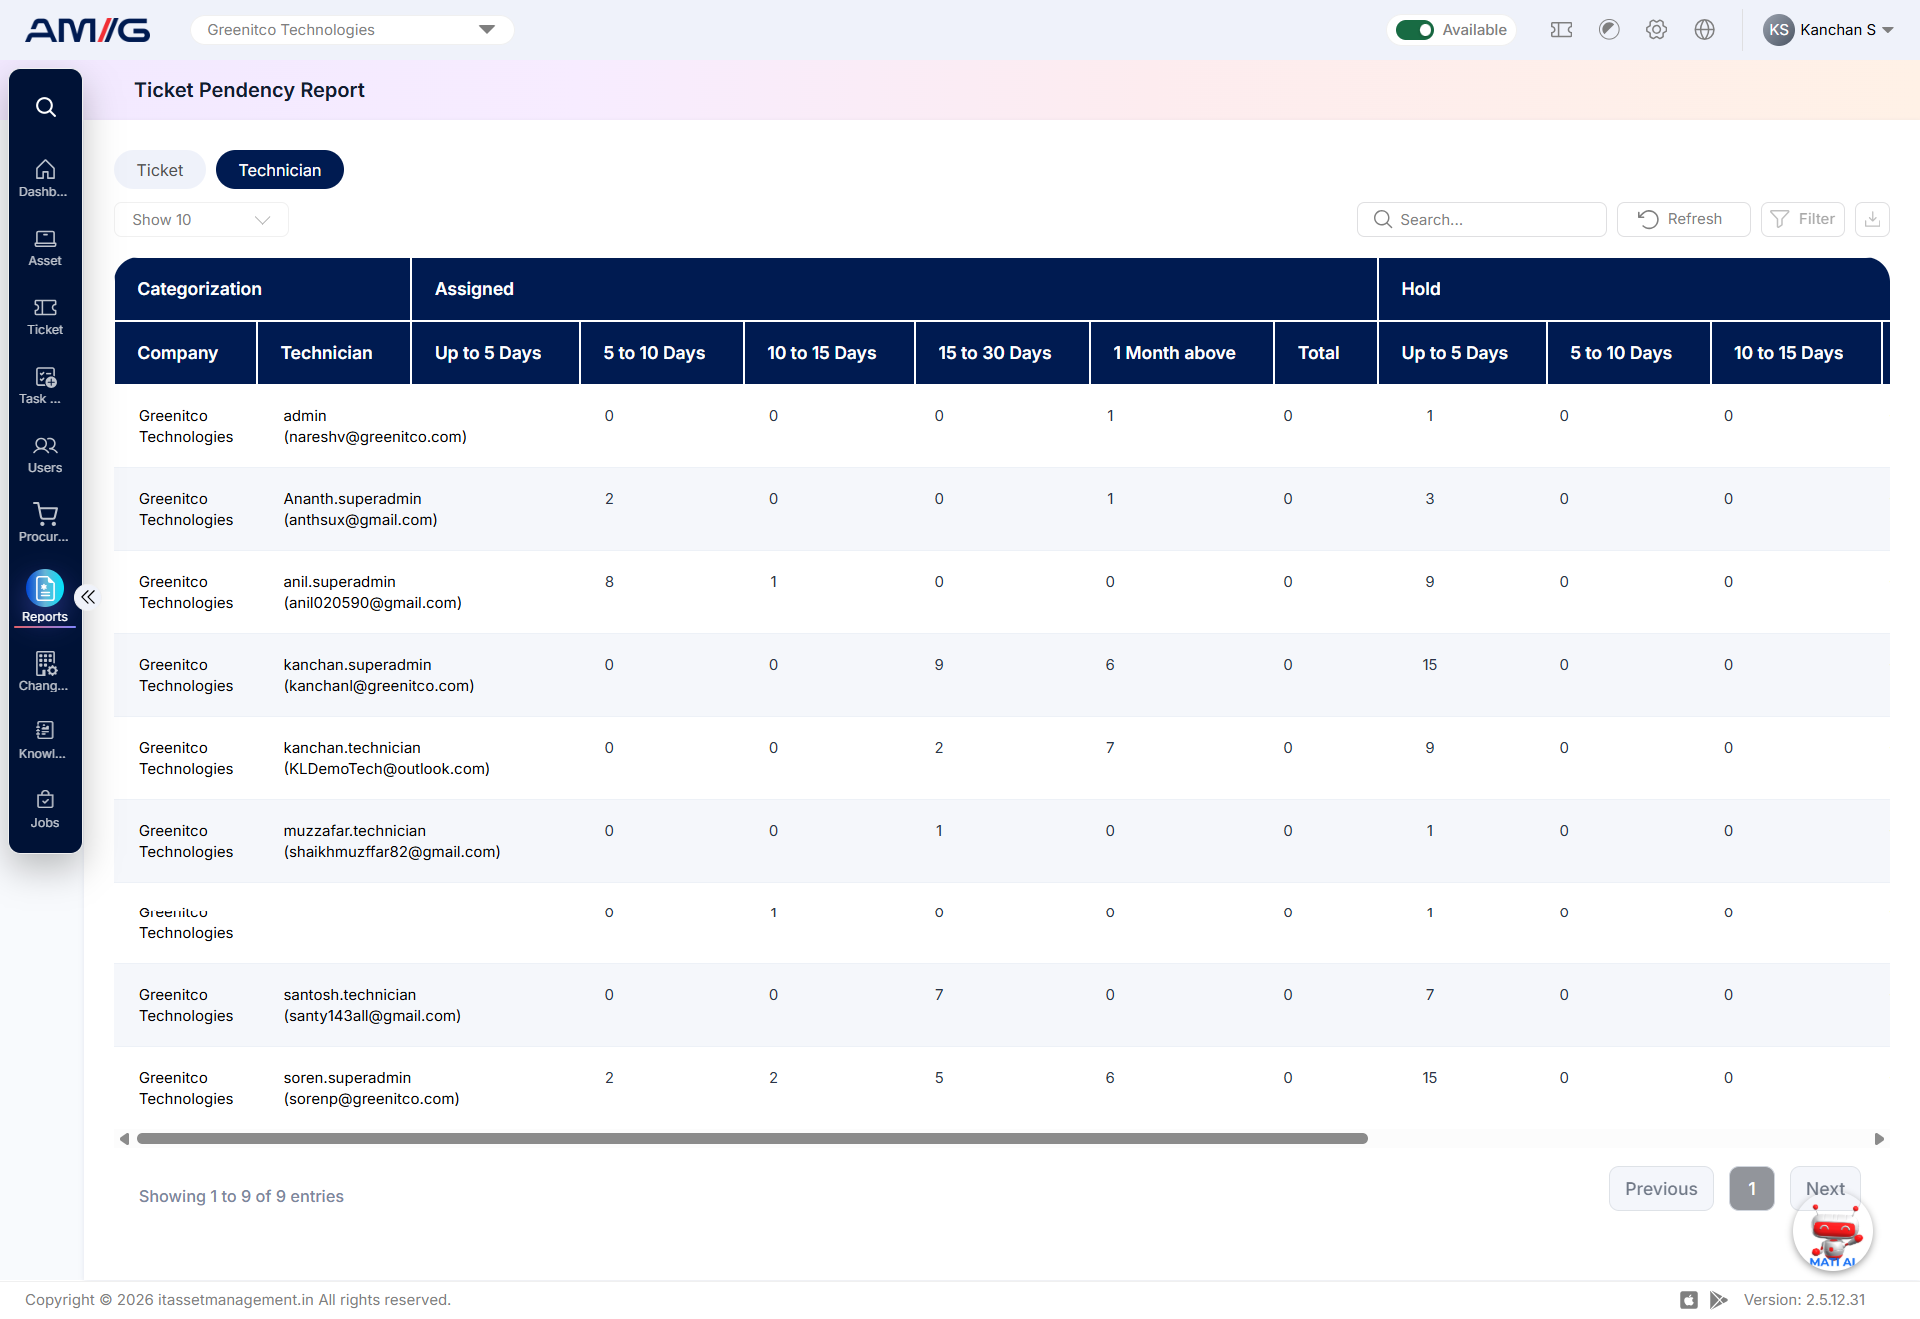 The report displays the following columns:
| Field | Description |
|---|---|
| Company | Displays the name of the company associated with the pending tickets. |
| Technician | Displays the name and email address of the technician associated with the tickets. |
| Up to 5 Days | Displays the number of assigned tickets pending for up to 5 days. |
| 5 to 10 Days | Displays the number of assigned tickets pending for 5 to 10 days. |
| 10 to 15 Days | Displays the number of assigned tickets pending for 10 to 15 days. |
| 15 to 30 Days | Displays the number of assigned tickets pending for 15 to 30 days. |
| 1 Month above | Displays the number of assigned tickets pending for more than one month. |
| Total | Displays the total number of assigned pending tickets for the technician. |
| Hold – Up to 5 Days | Displays the number of tickets on hold for up to 5 days. |
| Hold – 5 to 10 Days | Displays the number of tickets on hold for 5 to 10 days. |
| Hold – 10 to 15 Days | Displays the number of tickets on hold for 10 to 15 days. |
| Hold – 15 to 30 Days | Displays the number of tickets on hold for 15 to 30 days. |
| Hold – 1 Month above | Displays the number of tickets on hold for more than one month. |
| Hold – Total | Displays the total number of tickets on hold for the technician. |
| Total Backlog | Displays the total number of pending tickets, including assigned and on-hold tickets, for the technician. |
Note: Use the horizontal scrollbar to view additional columns in the report.